%%capture
# Setup
import emzed
import os

# paths to files
data_folder = os.path.join(os.getcwd(), "tutorial_data")
path_caulobacter_table = os.path.join(
    data_folder, "AA_sample_caulobacter_with_concentrations.table"
)
path_peaks_table = os.path.join(data_folder, "AA_peaks.table")
path_aa_conc_table = os.path.join(data_folder, "t_conc_ara_caulo.table")
3 Working with Tables
In the chapter first steps we show how to use Table for LC-MS peak visualization. The underlying data structure of Table is an sqlite database and can be handled as such. The sqlite structure has several advantages compared to i.e. pandas as it enhances memory efficient processing of huge data sets (filtering, sorting, on disk operations, ...). Although not required, some very basic knowledge about SQL data bases (sqlite tutorial) can be helpful to better understand certain Table properties.
Goals
- Learning core Table features
- Getting familiar with Table and Column attributes
- Learning how to implement typical data processing steps
Creating Tables
You can create tables in many different ways. Until now we created a Table by loading a .csv file using emzed io module. Using .csv or .xls(x) files has the advantage that most people are familiar with those data formats. You just open an Excel file, define the column name in the first row and then add the values. In the following we will create Tables in emzed from scratch.
This can be done column by column starting with to_table to create the initial column. An example:
compounds = ["Alanine", "Valine"]
t = emzed.to_table("compounds", compounds, str)
t
| compounds |
|---|
| str |
| Alanine |
| Valine |
After initializing the first Table column we can just continue adding columns as already demonstrated in chapter 2:
molecular_formulas = ["C3H7NO2", "C5H11NO2"]
masses = [89.0477, 117.079]
t.add_column("mf", molecular_formulas, str)
t.add_column("m0", masses, emzed.MzType)
t
| compounds | mf | m0 |
|---|---|---|
| str | str | MzType |
| Alanine | C3H7NO2 | 89.047700 |
| Valine | C5H11NO2 | 117.079000 |
Alternatively, we can use the Table method create_table to create the complete Table at once:
create_table = emzed.Table.create_table
col_names = ["compound", "mf", "m0"]
col_types = [str, str, emzed.MzType]
# we create a list of rows with its values:
rows = [
    ["Alanine", "C3H7NO2", 89.0477],
    ["Valine", "C5H11NO2", 117.079],
]
# we build the table
t = create_table(col_names, col_types, rows=rows)
t
| compound | mf | m0 |
|---|---|---|
| str | str | MzType |
| Alanine | C3H7NO2 | 89.047700 |
| Valine | C5H11NO2 | 117.079000 |
To build the same table with the method create_table we require values for the arguments col_names, col_types, and rows. Note, rows must be a list of row values and not a a list of column values. Accordingly, rows = [compounds, molecular_formulas, masses] will cause an error. However, you can use Python's built-in function zip to transform a list of column values into a list of row values:
# we build the table
rows = list(zip(compounds, molecular_formulas, masses))
t = create_table(col_names, col_types, rows=rows)
t
| compound | mf | m0 |
|---|---|---|
| str | str | MzType |
| Alanine | C3H7NO2 | 89.047700 |
| Valine | C5H11NO2 | 117.079000 |
create_table has additional arguments we did not need to create our table. A complete description of all arguments is available via the doc string.
Editing and rearranging
To introduce Table editing features, we will use the table aa_caulobacter_table which has been created with a workflow similar to the one we introduced in chapter 2 but included an additional quantification step.
t = emzed.io.load_table(path_caulobacter_table)
When inspecting the table using
emzed.gui.inspect(t)
A title is missing in the Table explorer and we have no information about the raw data source. Since we know the source, we can simply assign a title to the table via
t.title = "caulobacter sample"
t.title
'caulobacter sample'
However, manually changing the title is error prone and cumbersome. It's better to take the information from the direct source of the sample data: the peak map. To do so we have to (1) access the peak map of the table, (2) extract the name of the data file and assign the value to Table attribute title.
pm = t.peakmap.unique_value()
source = pm.meta_data["source"]
t.title = source
t.title
'AA_sample_caulobacter.mzML'
With Column method unique_value we returns the unique column value in case all column values are identical. The method will cause an error in case there is more than one value or the value is None. Note, all peak maps have the attribute meta_data, which is a dictionary:
pm.meta_data.keys()
['full_source', 'source']
and the key source returns the file name whereas full_source returns the path. Note Tables also have the attribute meta_data providing information about the path and and columns visible in Table explorer (for details see here).
t.meta_data.keys()
['hide_in_explorer', 'path']
Until now, we always visualized table t using emzed.gui.inspect(t), or t.info(), or print(t). However, we can get information about table attributes in a more targeted way:
t.col_names
('id',
 'compound',
 'mf',
 'm0',
 'mz',
 'mzmin',
 'mzmax',
 'rtmin',
 'rtmax',
 'peakmap',
 'peak_shape_model',
 'area',
 'rmse',
 'valid_model',
 'c_std_uM',
 'conc_factor',
 'c_uM',
 'model')
t.col_types
(int,
 str,
 str,
 float,
 emzed.table.col_types.MzType,
 emzed.table.col_types.MzType,
 emzed.table.col_types.MzType,
 emzed.table.col_types.RtType,
 emzed.table.col_types.RtType,
 emzed.ms_data.peak_map.PeakMap,
 str,
 float,
 float,
 bool,
 float,
 float,
 float,
 object)
t.col_formats
('%d',
 '%s',
 '%s',
 '%f',
 '%11.6f',
 '%11.6f',
 '%11.6f',
 <function emzed.table.col_types.rt_formatter(v)>,
 <function emzed.table.col_types.rt_formatter(v)>,
 None,
 '%s',
 '%.2e',
 '%.2e',
 <function emzed.table.col_types.bool_formatter(v)>,
 '%.2f',
 '%.3f',
 '%.2f',
 None)
The output of col_names provides a tuple of all column names having the same order as in the table. You might realize that some of the listed columns are not visible when you inspect the column. For instance, the column model is not visible since the column format is None. Column model is added when applying integrate to the table. It contains all information needed for visualization of integrated peaks. Analogous, col_types results in a list of types and col_formats a list of formats in column order, respectively.
In many cases, the detailed processing results are only relevant for the expert. A collaborator might simply be interested in the sample and its amino acid concentrations and all other columns are unnecessary.
t.col_names
result = t.extract_columns("id", "compound", "c_uM")
print(result)
id   compound       c_uM
int  str            float
---  -------------  -----
  0  Phenylalanine   0.00
  1  Leucine         1.08
  2  Tryptophane     0.11
  3  Isoleucine      1.23
  4  Methionine      0.13
  5  Valine          2.33
  6  Proline         0.68
  7  Tyrosine       14.84
  8  Cysteine        8.41
  9  Alanine         1.16
 10  Threonine       3.49
 12  Glycine            -
 13  Glutamine      19.90
 14  Glutamate      37.70
 15  Serine          1.64
 16  Asparagine      0.16
 17  Aspartate          -
 18  Histidine       0.32
 19  Arginine        0.00
 20  Lysine          0.72
We might not be satisfied with a column name. Here an example how to change a column name:
result.rename_columns(compound="amino_acid")
result.col_names
('id', 'amino_acid', 'c_uM')
Our standard sample contains only 17 amino acids, here we display also amino acids where we didn't measure any standard. We can remove those lines from the sample using the table.filter method:
missing = "Glycine", "Aspartate"
final = result.filter(result.amino_acid.is_in(missing) == False)
print(final)
id   amino_acid     c_uM
int  str            float
---  -------------  -----
  0  Phenylalanine   0.00
  1  Leucine         1.08
  2  Tryptophane     0.11
  3  Isoleucine      1.23
  4  Methionine      0.13
  5  Valine          2.33
  6  Proline         0.68
  7  Tyrosine       14.84
  8  Cysteine        8.41
  9  Alanine         1.16
 10  Threonine       3.49
 13  Glutamine      19.90
 14  Glutamate      37.70
 15  Serine          1.64
 16  Asparagine      0.16
 18  Histidine       0.32
 19  Arginine        0.00
 20  Lysine          0.72
The second line of the code needs some explanation: In general, table.filter evaluates if an expression is true or false and keeps only those rows of the table fulfilling the condition(s). In our case we use the column attribute is_in to determine for each values of the column amino_acid whether it is an element of missing. However, the list missing contains the amino acids we want to remove from the Table. Thus, the term would exactly keep those rows we want to remove. On the other hand, we want to keep most of the amino acids and a list with the amino acids we want to keep would be quite long. Lazy people often have good ideas. By evaluating expression == False we invert the expression meaning the expression must be false to be true.
The table.filter method is extremely useful and has many applications in the daily routine. Another example. We are only interested in amino acids with concentrations of at least 1 uM.
final = final.filter(result.c_uM >= 1)
We might want to change the column format, i.e. we prefer a scientific representation of the concentrations
final.set_col_format("c_uM", "%.1e")
print(final)
id   amino_acid  c_uM
int  str         float
---  ----------  -------
  1  Leucine     1.1e+00
  3  Isoleucine  1.2e+00
  5  Valine      2.3e+00
  7  Tyrosine    1.5e+01
  8  Cysteine    8.4e+00
  9  Alanine     1.2e+00
 10  Threonine   3.5e+00
 13  Glutamine   2.0e+01
 14  Glutamate   3.8e+01
 15  Serine      1.6e+00
An overview of frequently used Table formats is shown in the table below:
| type | format | value | formatted |
|---|---|---|---|
| int, float | %.3f |
0.0028 | 0.003 |
| int, float | %.2e |
583100 | 5.83e+05 |
| int, float | %d |
5.03 | 5 |
| MzType | %11.6f |
147.11 | 147.110000 |
| RtType | rt_formatter | 120.00 | 2.00 m |
| str | ‘%s’ | lysine | lysine |
| object (any type) | None | not visible | |
| object (any type) | %r |
{‘a’ : 1.23} | {‘a’ : 1.23} |
Comparing Tables
Since tables feature LC-MS data visualization, data of different samples can be directly compared within a single Table. Let us start by comparing the standard measurement shown in peaks_table with our sample. To compare tables, we have to build a new table from the samples. In principle, tables can be merged in (1) row-wise or (2) column-wise.
peaks_table = emzed.io.load_table(path_peaks_table)
Row-wise
To merge Tables row-wise we can use the Table method stack_tables. The method requires that all tables must have columns of the same name, type, and format in the same order. When processing samples with the same workflow this is given in most of the cases. However, the given example peaks table and sample table t have different columns. A straightforward way to compare the columns is transforming the column names into sets:
set(t.col_names) - set(peaks_table.col_names)
{'c_uM'}
set(peaks_table.col_names) - set(t.col_names)
set()
Obviously, column c_uM is missing in peaks_table. There are now different ways to cope with the missing column. We could simply add the missing column to our peaks table using peaks_table.add_column_with_constant_value, we could remove the column from the sample t using t.drop_columns, or we can extract the common columns from the sample table using t.extract_columns. The latter method is not in place and hence we do not change the original Table.
sample = t.extract_columns(*peaks_table.col_names)
Some explanations:
The command
t.extract_column(col_name_1, col_name_2, ..., col_name_n)
returns a new Table with all columns whose names are listed as function arguments. If the number of columns to be extracted is long, there is an elegant way to unpack lists or tuples as function arguments using *. Since the Table attribute col_names returns a tuple with column names in the correct order, we can unpack those names directly.
Another issue which comes along with table stacking: after stacking the tables together we do no longer know which row belongs to which sample. We need an identifier for the sample. We can again use the source of the peak map.
def update_source(t, insert_after="compound"):
    pm = t.peakmap.unique_value()
    source = pm.meta_data["source"]
    t.add_column_with_constant_value("source", source, str, insert_after=insert_after)
Finally we can execute following commands:
update_source(sample)
update_source(peaks_table)
t_comp = emzed.Table.stack_tables([sample, peaks_table])
emzed.gui.inspect(t_comp)
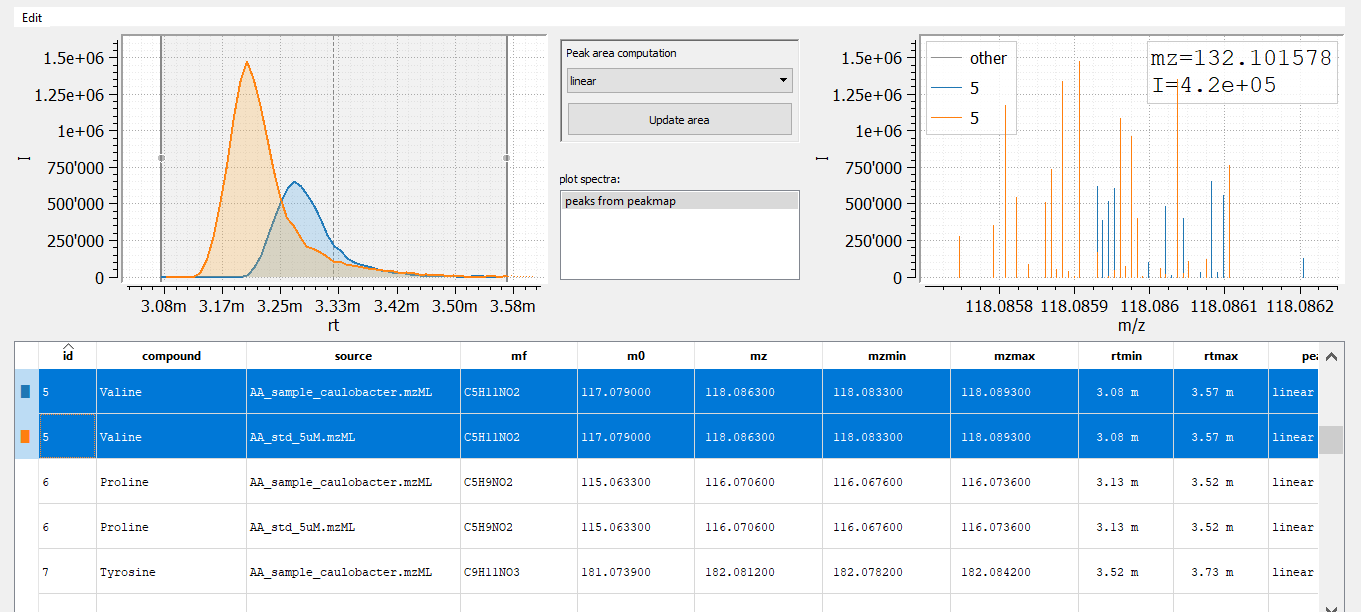
When inspecting the results, we observe that identical amino acids differ in retention times. This is because both samples were measured in different batches with different columns and with slightly modifier methods. However, RT alignment should fix that problem. We will come to this later.
Column-wise
Alternatively, we can use the Table.join or Table.left_join method:
t_comp = peaks_table.join(sample, peaks_table.compound == sample.compound)
The resulting column looks like follows
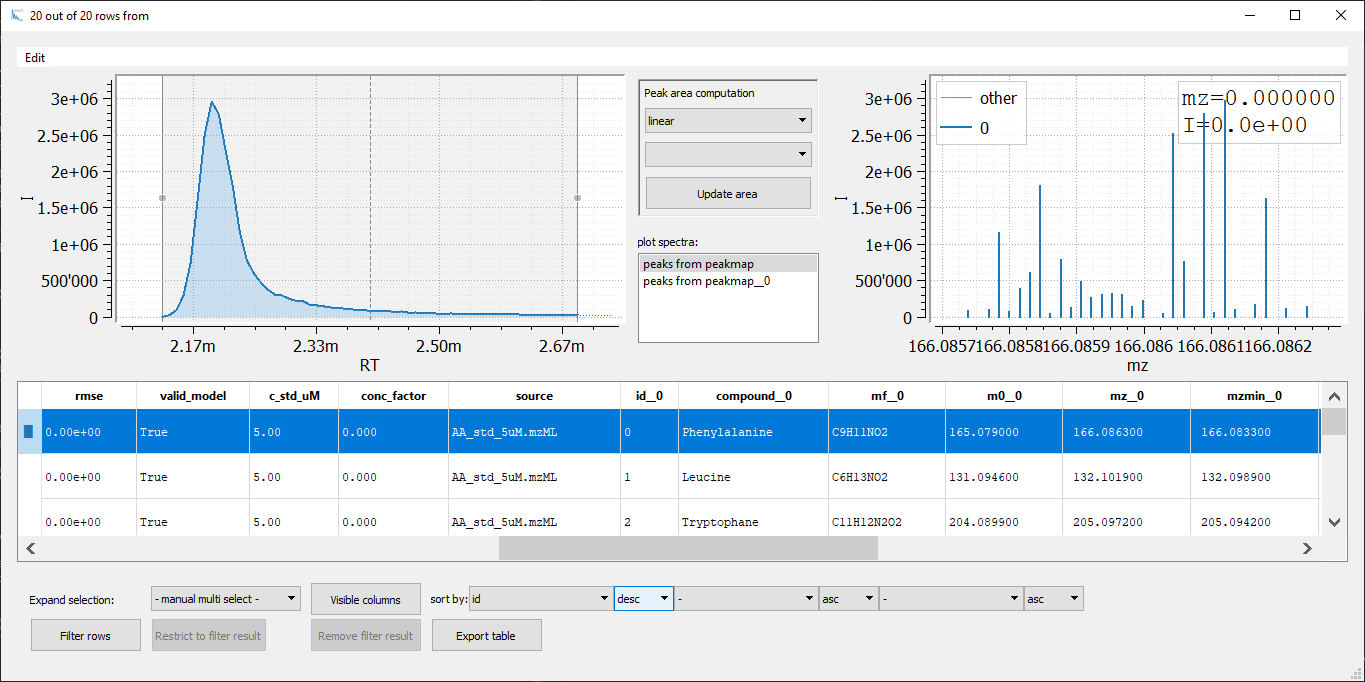
At first glance, horizontal merging via join seems to be much more efficient. Each row contains the result of a single amino acid for all samples. However, with each join you will double the number of columns. To keep the column names unique postfixes __0, __1, ... are added to each column name which requires postfix handling for further processing. Hence, for comparison of multiple samples vertical merging in combination with row indexing is much better suited. Nevertheless, joining of two tables is a powerful tool for more sophisticated table comparisons.
Note that you can also display the chromatogram and mass spectrum for the two peakmaps simultaneously by selecting both peakmaps in the plot spectra box (hold Ctrl/Cmd while selecting). This is a handy way to directly compare the peaks of two (or more) samples.
Column operations
You can directly apply functions to one or more table columns with t.apply(), an extremely powerful the method featuring sophisticated operations on tables. It is used in combination with add_column(), replace_column(), or add_or_replace_column(). Let's create an example table:
t = emzed.to_table("a", ["apple"], str)
t.add_column("b", ["juice"], str)
t
| a | b |
|---|---|
| str | str |
| apple | juice |
We can now define a function that combines two strings with a delimiter:
def combine(a, b, delimiter):
    return a + delimiter + b
Now we can add a new column combined to the table with the command:
t.add_or_replace_column("combined", t.apply(combine, t.a, t.b, "_"), str)
t
| a | b | combined |
|---|---|---|
| str | str | str |
| apple | juice | apple_juice |
We add or replace column combined to the table t, yielding the corresponding values with the method apply. apply takes the function we want to apply as first argument, followed by the function arguments.
In given example, t.apply calls the function combine with its arguments a, b, link handing over t.a as argument a, t.b as argument b, and the string '_' as argument link. As you might have noticed, it is possible to combine Table columns with any other object accepted as argument by the function called.
A second, more relevant example. Currently peak_table has the columns rtmin and rtmax, but the retention time column 'rt' is missing. We could simply estimate the value by (rtmin + rtmax) / 2. However, this is not completely accurate since the peak apex is not always placed in the middle of the RT window. A better way would be to determine the retention time at max intensity, which can be obtained from peak integration. The column model contains the required peak information.
import matplotlib.pyplot as plt  # from matplotlib library

# we get the model object in the first row
model = peaks_table.model.to_list()[0]

# we extract retention times and intensities
rts, ints = model.graph()

# we split the peak
plt.plot(rts, ints)
plt.show()

Hence, we can get the retention time at peak appex from the model graph. Here is a possible function returning the retention time at appex.
def get_rt(model, rtmin, rtmax):
    rts, ints = model.graph()  # iterable of (rt, intensity) pairs
    # find rt with highest intensity
    if len(rts):
        rt, _ = max(zip(rts, ints), key=lambda v: v[1])
        return rt
    # in case the peak does not exist
    return (rtmin + rtmax) / 2
We can now define a more sophisticated function update_retention_time(t), which adds or replaces a column rt to the table.
def update_retention_time(t):
    t.add_or_replace_column(
        "rt", t.apply(get_rt, t.model, t.rtmin, t.rtmax), emzed.RtType
    )
Column names as string representation
So far, we directly accessed a column by the corresponding table attribute, e.g.:
t.peakmap.unique_value()
This works fine as long as we have fixed column names. It also means that we have to change the code of a function as soon as we change the name of a column, which can be cumbersome and error prone.
For instance, we previously changed the column name compound to amino_acid. Any function, using fixed column names in the expression will fail after the renaming. We can avoid this problem by using a string representation of the name. In given example, the column name is compound and hence using the string representation we can access the columns compound by:
t.get_column('compound')
# or
t['compound']
Grouping and splitting
Grouping rows is another important Table feature. There exists many possible use cases and it plays an important role in workflow routines. Most grouping routines can be adressed with Table method group_by. Again, we can take our amino analysis results to learn how to use it. For instance: Which amino acid is most abundant in which sample?
To answer the question let us load a Table containing the amino acid concentations of Caulobacter and Arabidopsis samples.
t = emzed.io.load_table(path_aa_conc_table)
print(t[:5])
id   source                      compound       c_uM
int  str                         str            float
---  --------------------------  -------------  --------
  0  AA_sample_caulobacter.mzML  Phenylalanine  4.09e-01
  1  AA_sample_caulobacter.mzML  Leucine        1.08e+00
  2  AA_sample_caulobacter.mzML  Tryptophane    1.09e-01
  3  AA_sample_caulobacter.mzML  Isoleucine     1.23e+00
  4  AA_sample_caulobacter.mzML  Methionine     1.32e-01
We can now group the rows by combound name
grouped = t.group_by(t.compound)
We obtain a 'grouped_by' object named 'grouped' where Table rows are grouped by the column 'compound'. The group_by objects provides a number of methods like e.g. min, max, std, mean, median, sum, ... Since we are interested in the compound-wise maximal amino acid concentration:
t.add_or_replace_column("c_max_uM", grouped.max(t.c_uM), float, "%.2e")
print(t[:5])  # only the first 5 rows
id   source                      compound       c_uM      c_max_uM
int  str                         str            float     float
---  --------------------------  -------------  --------  --------
  0  AA_sample_caulobacter.mzML  Phenylalanine  4.09e-01  4.09e-01
  1  AA_sample_caulobacter.mzML  Leucine        1.08e+00  1.08e+00
  2  AA_sample_caulobacter.mzML  Tryptophane    1.09e-01  2.92e-01
  3  AA_sample_caulobacter.mzML  Isoleucine     1.23e+00  1.23e+00
  4  AA_sample_caulobacter.mzML  Methionine     1.32e-01  1.32e-01
Finally, we can use the again Table.filter to obtain the most intense amino acids
most_intense = t.filter(t.c_uM.approx_equal(t.c_max_uM, 1e-6, 0))
print(most_intense[:5])
id   source                      compound       c_uM      c_max_uM
int  str                         str            float     float
---  --------------------------  -------------  --------  --------
  0  AA_sample_caulobacter.mzML  Phenylalanine  4.09e-01  4.09e-01
  1  AA_sample_caulobacter.mzML  Leucine        1.08e+00  1.08e+00
  3  AA_sample_caulobacter.mzML  Isoleucine     1.23e+00  1.23e+00
  4  AA_sample_caulobacter.mzML  Methionine     1.32e-01  1.32e-01
  5  AA_sample_caulobacter.mzML  Valine         2.33e+00  2.33e+00
Remarks:
Intuitively, for filtering one would compare whether values in the column 'c_uM' and 'c_max_uM' are equal. However, comparing numerical values via '==' is critical when values were calculated. One solution is to use the column expression
approx_equal(t[col_name], atol, rtol)with atol as absolute and rtol as relative tolerance.We separated the group_by operation into 2 logical steps. Here, the single line command:
t.add_or_replace_column('c_max_uM', t.group_by(t.compound).max(t.c_uM), float, "%.2e")In above example we extract the sample with maximal concentration for each amino acid with
filterand we loose the concentration in all other samples. Alternatively, we can add a new columnmax_sample_nameshowing the name of the sample with the maximal concentration of each amino acid. This is possible with methodgroup_by.aggregate, which allows applying a user defined function to the 'group_by' object.
Let's find the name of the sample with maximal concentration and add it as a new column:
# the function required for agregate
def name_of_max_sample(concs, names):
    # we create a list of tuples -> [(conc1, source1), ...]
    pairs = zip(concs, names)
    # max considers first element first, then second:
    max_pair = max(pairs)
    # return only the sample name
    return max_pair[1]
t = emzed.io.load_table(path_aa_conc_table)
grouped = t.group_by(t.compound)
t.add_or_replace_column(
    "max_sample_name",
    grouped.aggregate(name_of_max_sample, t.c_uM, t.source),
    str,
)
print(t[:5])
id   source                      compound       c_uM      max_sample_name
int  str                         str            float     str
---  --------------------------  -------------  --------  --------------------------
  0  AA_sample_caulobacter.mzML  Phenylalanine  4.09e-01  AA_sample_caulobacter.mzML
  1  AA_sample_caulobacter.mzML  Leucine        1.08e+00  AA_sample_caulobacter.mzML
  2  AA_sample_caulobacter.mzML  Tryptophane    1.09e-01  AA_sample_arabidopsis.mzML
  3  AA_sample_caulobacter.mzML  Isoleucine     1.23e+00  AA_sample_caulobacter.mzML
  4  AA_sample_caulobacter.mzML  Methionine     1.32e-01  AA_sample_caulobacter.mzML
As you might have noticed the grouped_by method aggregate and the table method apply are highly similar. Whereas apply always operates row-wise aggregate features column-wise operations on grouped rows. Hence, clever row indexing enables highly flexible table operations.
To split a table into several sub-tables by column(s), Table provides the splitting methods split_by returning a list of Tables and split_by_iter returning a memory efficient generator object. As a general rule, you might use split_by when expecting few tables and split_by_iter when expecting many tables after the split process. Let us split the table by max_sample_name:
tables = t.split_by("max_sample_name")
for sub in tables:
    sub.print_(4)
    print("\n")
id   source                      compound       c_uM      max_sample_name
int  str                         str            float     str
---  --------------------------  -------------  --------  --------------------------
  0  AA_sample_caulobacter.mzML  Phenylalanine  4.09e-01  AA_sample_caulobacter.mzML
...  ...                         ...                 ...  ...
 19  AA_sample_arabidopsis.mzML  Arginine       0.00e+00  AA_sample_caulobacter.mzML
 20  AA_sample_arabidopsis.mzML  Lysine         0.00e+00  AA_sample_caulobacter.mzML


id   source                      compound     c_uM      max_sample_name
int  str                         str          float     str
---  --------------------------  -----------  --------  --------------------------
  2  AA_sample_caulobacter.mzML  Tryptophane  1.09e-01  AA_sample_arabidopsis.mzML
...  ...                         ...               ...  ...
 16  AA_sample_arabidopsis.mzML  Asparagine   3.09e+01  AA_sample_arabidopsis.mzML
 17  AA_sample_arabidopsis.mzML  Aspartate    1.92e+01  AA_sample_arabidopsis.mzML


id   source                      compound  c_uM   max_sample_name
int  str                         str       float  str
---  --------------------------  --------  -----  ---------------
 12  AA_sample_caulobacter.mzML  Glycine       -  -
 12  AA_sample_arabidopsis.mzML  Glycine       -  -
We get 3 tables by splitting, one table for each sample and one table where max_sample_name was None, thus containing the amino acids which have not been detected in any sample.
Adding and replacing columns between tables
You can add values that are linked by a shared identifier from one table to another with the column expression lookup:
t2.add_column(colname2, t2[id_col].lookup(t1[id_col], t1[colname1]), type)
The method requires a row identifier column in both the source and the target table where each row has a unique id and for each target id a source id exists. You can use lookup together with the table expressions add_column, replace_column, and add_or_replace_column. An example:
t1 = emzed.to_table("a", ["here", "comes", "sunshine"], str)
t1.add_enumeration()
t1
| id | a |
|---|---|
| int | str |
| 0 | here |
| 1 | comes |
| 2 | sunshine |
t2 = emzed.to_table("b", ["it`s", "rain", "enough!"], str)
t2.add_enumeration()
t2
| id | b |
|---|---|
| int | str |
| 0 | it`s |
| 1 | rain |
| 2 | enough! |
If we want sunshine in table t2 we can replace values of column b by values of column t1.a:
t2.replace_column("b", t2.id.lookup(t1.id, t1.a), str)
t2
| id | b |
|---|---|
| int | str |
| 0 | here |
| 1 | comes |
| 2 | sunshine |
The expression lookup is extremely useful if you just require a limited number of columns from another table with corresponding row identifiers, since it avoids cumbersome column removing and renaming after Table.join operations.
pandas data frame
Table provides the method to_pandas to transform Tables into pandas data frames and vice versa. The pandas DataFrame allows the easy application of multiple data analysis and visualization tools like i.e. statsmodels , seaborn, and many others of the pandas ecosystem.
t = emzed.io.load_table(path_caulobacter_table)
df = t.to_pandas()
# we plot the compound areas
df.plot.bar(x="compound", y="area")
<Axes: xlabel='compound'>

A single command writes a table into a pandas frame. And in principle the process is reversable with the table method from_pandas with common data types but columns peakmap and Table will be removed since they are not compatible with pandas data frames.
t1 = emzed.Table.from_pandas(df)
t1[:3]
| id | compound | mf | m0 | mz | mzmin | mzmax | rtmin | rtmax | peak_shape_model | area | rmse | valid_model | c_std_uM | conc_factor | c_uM |
|---|---|---|---|---|---|---|---|---|---|---|---|---|---|---|---|
| int | str | str | float | MzType | MzType | MzType | RtType | RtType | str | float | float | bool | float | float | float |
| 0 | Phenylalanine | C9H11NO2 | 165.079000 | 166.086300 | 166.083300 | 166.089300 | 2.12 m | 2.69 m | linear | 1038368.243826 | 0.000000 | True | 5.000000 | 0.000000 | 0.000000 |
| 1 | Leucine | C6H13NO2 | 131.094600 | 132.101900 | 132.098900 | 132.104900 | 2.14 m | 2.37 m | linear | 2606043.736817 | 0.000000 | True | 5.000000 | 0.000000 | 1.080549 |
| 2 | Tryptophane | C11H12N2O2 | 204.089900 | 205.097200 | 205.094200 | 205.100200 | 2.29 m | 2.40 m | linear | 127263.837542 | 0.000000 | True | 5.000000 | 0.000001 | 0.109118 |
"peakmap" in t1.col_names
False