4 GUIs
Graphical user interfaces (GUI) make working with workflows much more user friendly. The module emzed_gui provides interactive tools for LC-MS data visualization and a number of routines to create GUI(s) on your own.
Table explorer 
The table explorer provides a number of tools to allow the user the manual inspection and modification of emzed tables. To start with, we will create a small table to introduce the possible row, column, and cell operations:
t = emzed.to_table('a', [2, 125, 42], int)
t.add_enumeration()
emzed.gui.inspect(t)
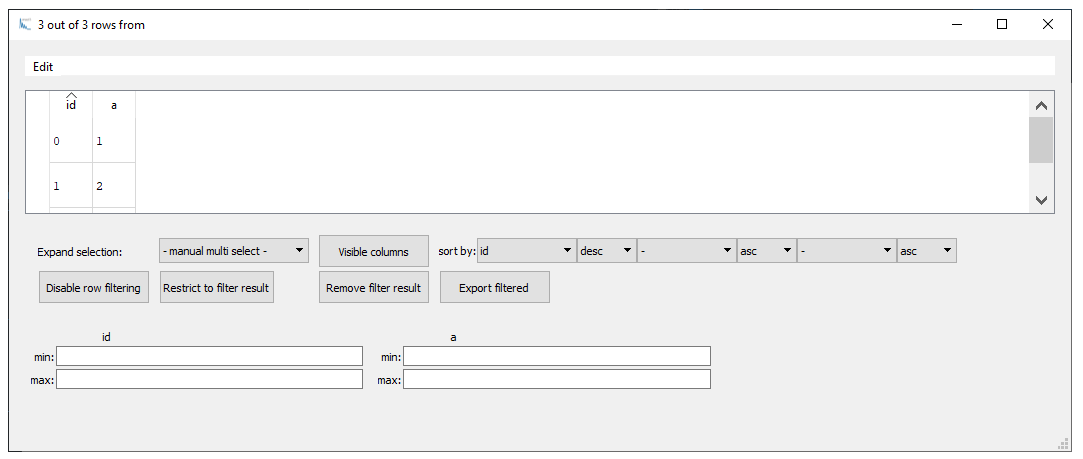
Most functionalities are self-explaining. All modifications are reversible (using Edit -> Undo). For instance, with the Filter rows button we can perform min / max filtering by defining boundary values for the different columns. You can save filtered results using the Export filtered button. The user can also change the visible columns. Note: if you change the visible columns, the current selection is kept even after closing the explorer window because the setting is written to the Table's meta_data dictionary and you can check for hidden columns with the command:
t.meta_data['hide_in_explorer']
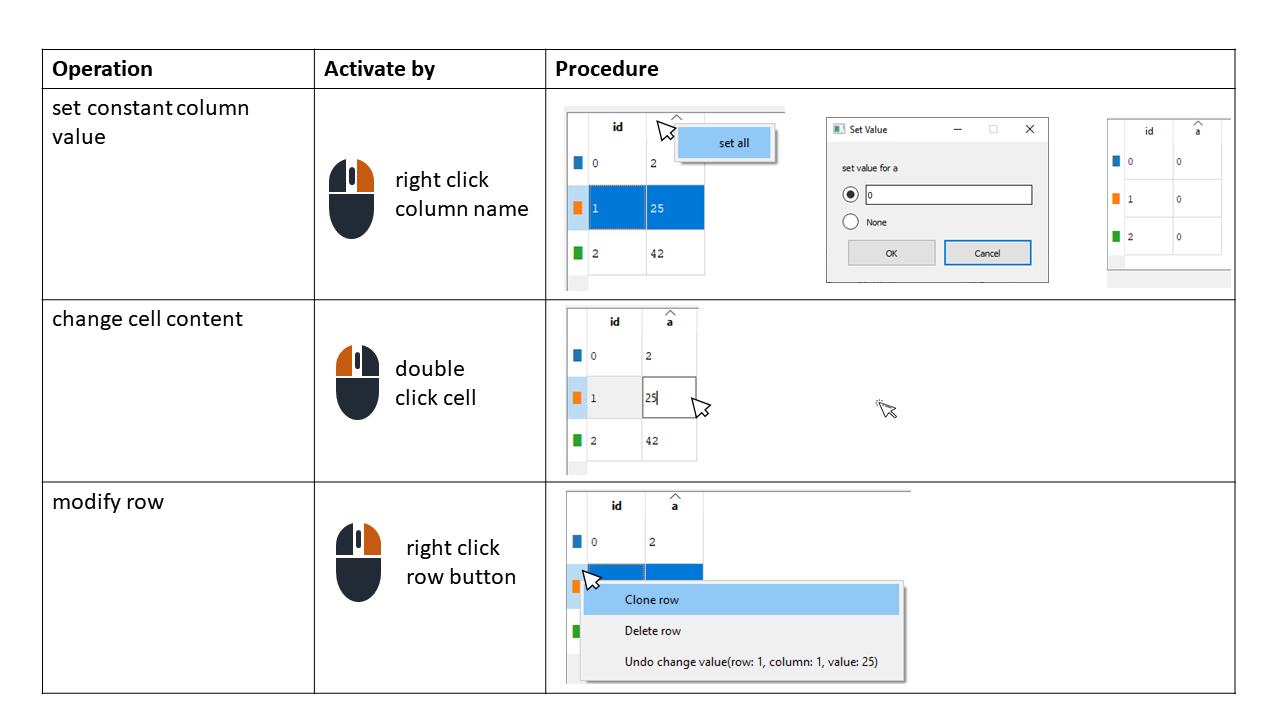
To modify cell content, set a constant column value for all rows, or delete or duplicate rows, we can use the mouse as shown in the scheme below:
You can label rows with color by adding a column with the fixed name color, whereby the color must be given as RGB code in hex format (e.g. '#ccffcc') or as comma separated RGB values (e.g. '128,256,128'). You might use the following link to generate the color code. In our example:
t.add_column_with_constant_value('color', '#E6ECFF', str)
emzed.gui.inspect()
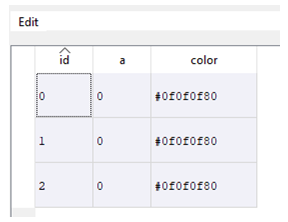
This is a very simple example. Color coding rows can be extremely useful when colors are assigned to conditions, e.g. you might color code data quality or groups. The user can now sort the table by color and quickly identify critical rows.
Table explorer is mostly used to visualize a peak table. Here is a quick summary that shows how you can adapt the display of extracted peaks and corresponding spectra using the mouse:
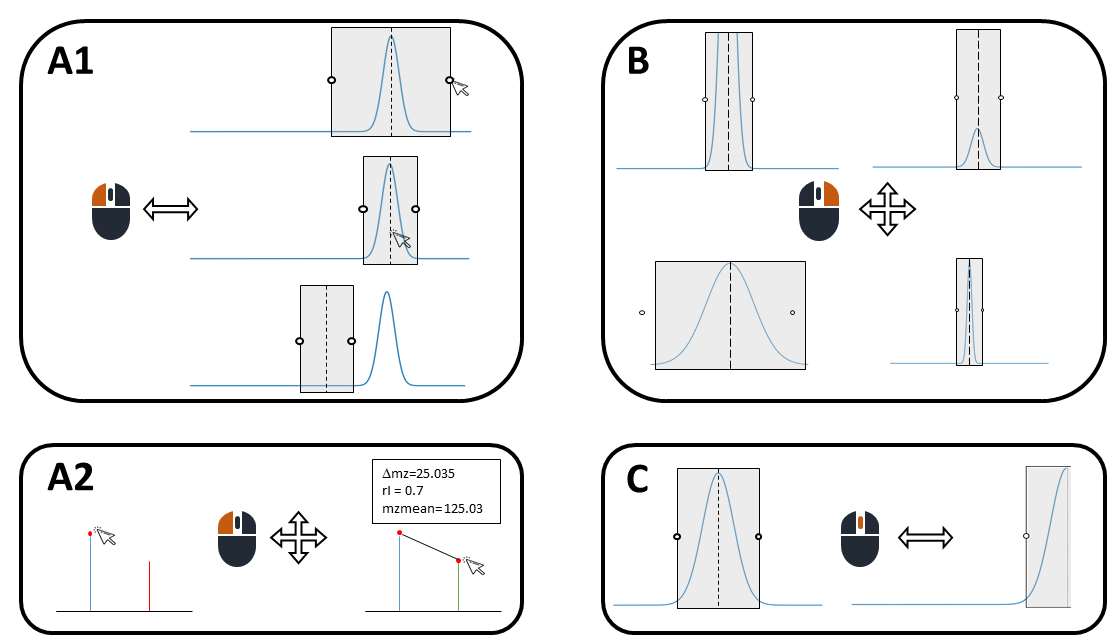
Scheme: Mouse functions in Table explorer. Left button: adapt size and move peak window (A1), measure spectrum peak distances and ratios (A2); right button: zoom in and out (B); middle button: move plot along x axis (C).
Finally, the table explorer allows the reintegration of peaks. Note, reintegration is only supported for already integrated tables (although the integration model can also be set to 'no_integration'). The scheme below shows an example:
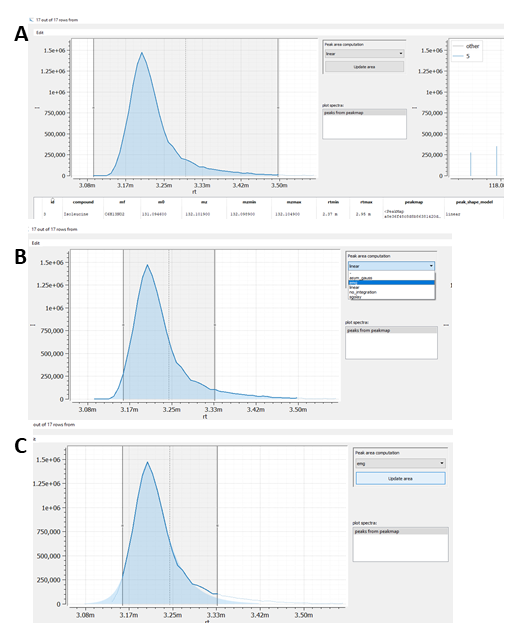
Scheme: Reintegrating peaks in Table Explorer. (A) Select row(s) that should be reintegrated. (B) Adapt the peak boundaries by moving/changing the peak selection window and selecting the integration model of choice. (C) Integration result after pressing Update area button.
Simple GUIs
We already encountered some simple GUIs when using the emzed.io module functions, which provide a simple GUI in case file paths are required. However, those GUIs are not very useful in a workflow context since several windows might pop up during data processing and it is hard to guess what the program wants us to do.
Emzed provides a couple of simple GUIs which can be added to the workflow to simplify interactive processing steps.
File selection
The emzed.gui module provides 2 functions to cope with interactive file(s) selecting.
emzed.gui.ask_for_single_file(start_at=None, extensions=None, caption='Open File')
emzed.gui.ask_for_multiple_files(start_at=None, extensions=None, caption='Open Files')
Both functions have the same arguments. ask_for_single_file() returns a path and as the name already sais, ask_for_multiple_files() allows multiple selections and returns a list of paths. Note, the functions only return the path (paths). You still have to load the file(s)! Let's have a look at the arguments. start_at allows you to define a folder path, which is opened when you call the function. The default value is None meaning, it will open the current working directory. The argument extensions allows to select for certain file extensions, and caption allows you to define the window title. For instance,
path = emzed.gui.ask_for_single_file(extensions=['mzML'], caption='Please select the amino acid standard')
opens the dialog window:

After selecting the sample path we can now simply load the amino acid standard file
aa_std = emzed.io.load_peak_map(path)
Yes/No dialogs
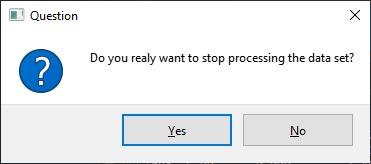
Another possible scenario for simple GUIs: Some operations might be critical e.g. a process will overwrite existing data or stop a process. For such critical operations a user dialog ensuring the operation is extremely useful.
msg = 'Do you really want to stop processing the data set?'
stop = emzed.gui.ask_yes_no(msg)
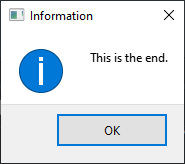
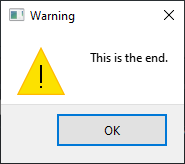
msg = 'This is the end.'
emzed.gui.show_information(msg)
emzed.gui.show_warning(msg)
Introducing the DialogBuilder
In chapter 2 we introduced a column named c_uM, which not only defines the category of the entry but also the unit: uM. We might also allow the user to define the column concentration_unit manually. Moreover, we want to separate the user dialog from processing since each user dialog interrupts the processing workflow. The DialogBuilder features minimizing the number of dialog windows. Note, DialogBuilder is not a function but a class that has methods to ask for different types of values. A simple example:
dialog = emzed.gui.DialogBuilder('Loading Data')
dialog.add_file_open('select AA standard')
data = dialog.show()
... results in:
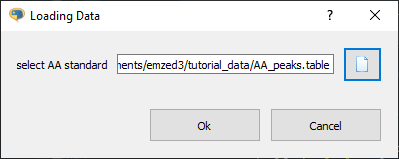
We define the caption of the dialog box during creation of the DialogBuilder object. The label of the data item you are asking for is defined in the called method. Finally the dialog is launched with the show() command. DialogBuilder returns a data holder object we named data in our example. To access the file path from data, type:
data.select_aa_standard
out: 'C:/Users/pkiefer/Work Folders/Documents/emzed3/tutorial_data/AA_peaks.table'
In other words, the label of the DialogBuilder method is the attribute name of the data holder object returning the user value. At first glance that is much more complicated than the corresponding simple GUI command ask_for_single_file. The advantage might get clearer with the following code example:
def get_workflow_params():
    units = ['nM', 'uM', 'mM']
    dialog = emzed.gui.DialogBuilder('Workflow Parameter Setup')
    dialog.add_file_open('select standard file', formats=['mzML', 'mzXML'])
    dialog.add_files_open('select sample files', formats=['mzML', 'mzXML'])
    dialog.add_choice('concentration unit', units, default = 1)
    data = dialog.show()
    return data
Executing the function get_workflow_params() results in the dialog:
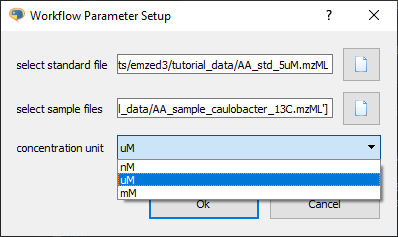
We also obtain a data object with the attributes select_standard_file, select_sample_files, and concentration_unit. The DialogBuilder allows us to ask for all required parameters in a single dialog. We have a nice separation of GUI and data processing. All data items are returned as data object. Note you can transform the data directly into a dictionary:
data.as_dict()
out: {'select_standard_file': 'C:/Users/pkiefer/Work Folders/Documents/emzed3/tutorial_data/AA_std_5uM.mzML',
 'select_sample_files': ['C:/Users/pkiefer/Work Folders/Documents/emzed3/tutorial_data/AA_sample_caulobacter.mzML',
  'C:/Users/pkiefer/Work Folders/Documents/emzed3/tutorial_data/AA_sample_caulobacter_13C.mzML'],
 'concentration_unit': 1}
In our case the dictionary contains the path of the standard, the paths of the samples and the concentration unit as integer. Notice that add_choice does not return the element of the list but the corresponding index, meaning:
concentration_unit = units[1]
Detailed information about all DialogBuilder methods are available via the help command i.e.
emzed.gui.DialogBuilder?