%%capture
import emzed
import os

# path to files
data_folder = os.path.join(os.getcwd(), "tutorial_data")
path = os.path.join(data_folder, "CoA_ester_ms_ms2.mzXML")
coa = emzed.io.load_peak_map(path)
7 Targeted sample analysis
In Chapter 2 we started targeted extraction of amino acids with a table containing the corresponding m/z values of protonized monoisotopic masses. The emzed module targeted provides the method solution_space supporting a more advanced approach of targeted peak extraction that includes possible isotopologues and adducts:
solution_space(targets, adducts, explained_abundance=0.999, resolution=None)
Arguments:
targets: a table with the 2 mandatory columnsidandmf, with columnmfcontaining the molecular formulas of interestadducts: a table of the emzed moduleemzed.adductswith selected adductsexplained_abundance: determines the number of isotopologue peaks taken into accountresolution: the mass resolution of the MS instrument $\frac{mz}{FWHM}$
The function returns the mz solution space of molecular formulas of selected adducts including isotopologues.
The number of included isotopologues depends on the parameter explained_abundance. Note, the larger a molecule, the more isotopologues will be included with the same value. As an example, we build the m/z solution space of the acetyl-CoA M+H ion:
# 1. we create the target table
target = emzed.to_table("mf", ["C23H38N7O17P3S"], str)
target.add_enumeration()
# 2. we select the adduct of interest
adducts = emzed.adducts.M_plus_H
# 3. we build the table
sp = emzed.targeted.solution_space
t = sp(target, adducts, explained_abundance=0.95, resolution=6e4)
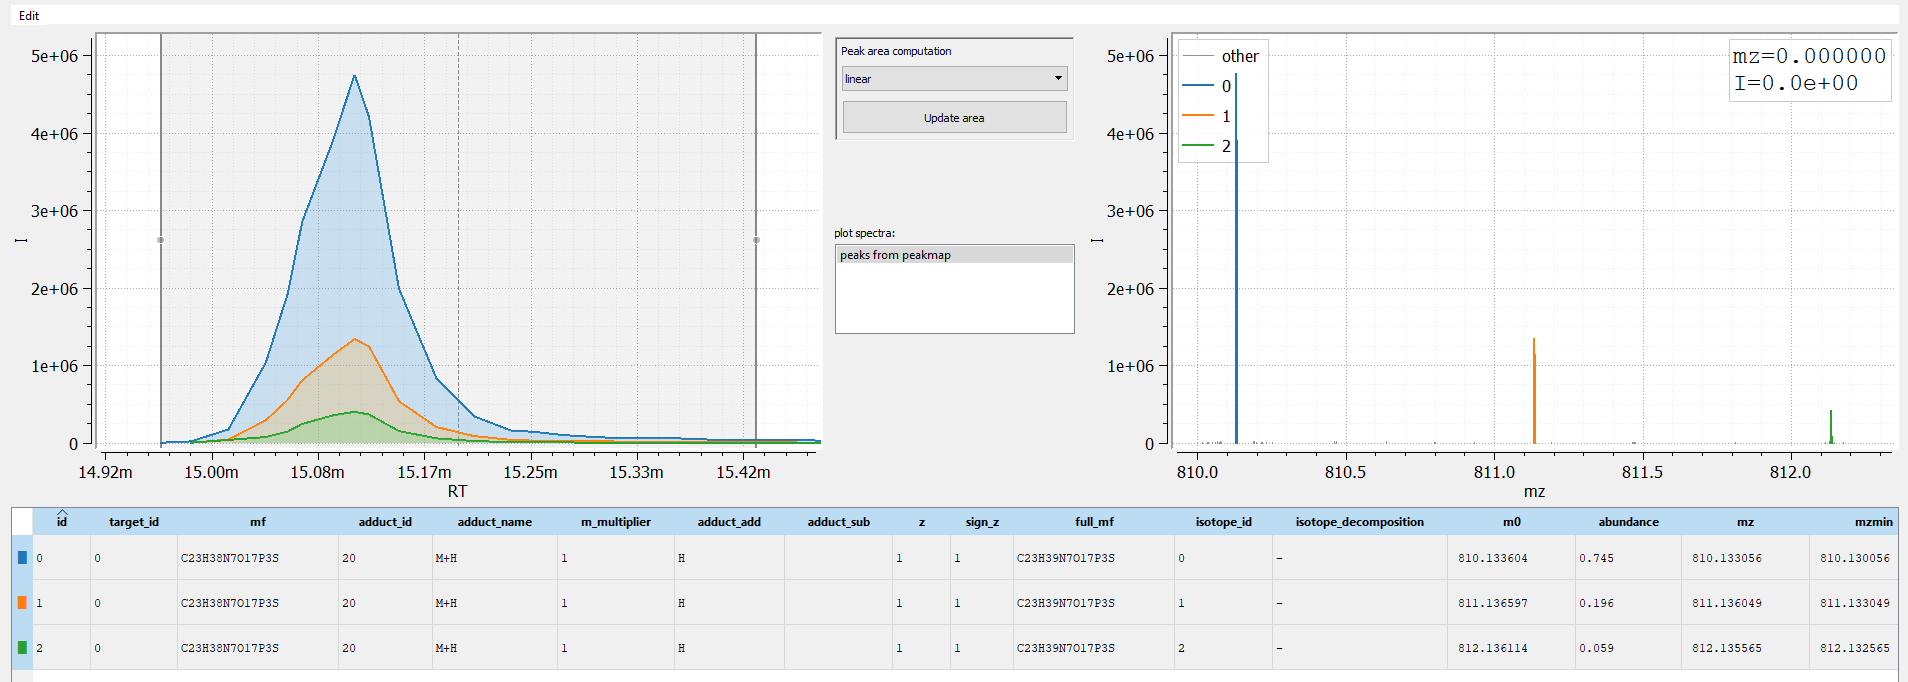
t
| id | target_id | mf | adduct_id | adduct_name | m_multiplier | adduct_add | adduct_sub | z | sign_z | full_mf | isotope_id | isotope_decomposition | m0 | abundance | mz |
|---|---|---|---|---|---|---|---|---|---|---|---|---|---|---|---|
| int | int | str | int | str | int | str | str | int | int | str | int | str | MzType | float | MzType |
| 0 | 0 | C23H38N7O17P3S | 20 | M+H | 1 | H | 1 | 1 | C23H39N7O17P3S | 0 | - | 810.133604 | 0.745 | 810.133056 | |
| 1 | 0 | C23H38N7O17P3S | 20 | M+H | 1 | H | 1 | 1 | C23H39N7O17P3S | 1 | - | 811.136597 | 0.196 | 811.136049 | |
| 2 | 0 | C23H38N7O17P3S | 20 | M+H | 1 | H | 1 | 1 | C23H39N7O17P3S | 2 | - | 812.136114 | 0.059 | 812.135565 |
Once we determined the solution space, we can continue as explained in chapter 2:
# we initially use the whole RT range of the peakmap

rtmin, rtmax = coa.rt_range()
mztol = 0.003


def add_peak_columns(t, rtmin, rtmax, peakmap):
    t.add_column("mzmin", t.mz - mztol, emzed.MzType)
    t.add_column("mzmax", t.mz + mztol, emzed.MzType)
    t.add_column_with_constant_value("rtmin", rtmin, emzed.RtType)
    t.add_column_with_constant_value("rtmax", rtmax, emzed.RtType)
    t.add_column_with_constant_value("peakmap", peakmap, emzed.PeakMap)


add_peak_columns(t, rtmin, rtmax, coa)
t = emzed.quantification.integrate(t, "linear", ms_level=1, show_progress=False)
t
| id | target_id | mf | adduct_id | adduct_name | m_multiplier | adduct_add | adduct_sub | z | sign_z | full_mf | isotope_id | isotope_decomposition | m0 | abundance | mz | mzmin | mzmax | rtmin | rtmax | peak_shape_model | area | rmse | valid_model |
|---|---|---|---|---|---|---|---|---|---|---|---|---|---|---|---|---|---|---|---|---|---|---|---|
| int | int | str | int | str | int | str | str | int | int | str | int | str | MzType | float | MzType | MzType | MzType | RtType | RtType | str | float | float | bool |
| 0 | 0 | C23H38N7O17P3S | 20 | M+H | 1 | H | 1 | 1 | C23H39N7O17P3S | 0 | - | 810.133604 | 0.745 | 810.133056 | 810.130056 | 810.136056 | 5.10 m | 32.01 m | linear | 2.67e+07 | 0.00e+00 | True | |
| 1 | 0 | C23H38N7O17P3S | 20 | M+H | 1 | H | 1 | 1 | C23H39N7O17P3S | 1 | - | 811.136597 | 0.196 | 811.136049 | 811.133049 | 811.139049 | 5.10 m | 32.01 m | linear | 7.38e+06 | 0.00e+00 | True | |
| 2 | 0 | C23H38N7O17P3S | 20 | M+H | 1 | H | 1 | 1 | C23H39N7O17P3S | 2 | - | 812.136114 | 0.059 | 812.135565 | 812.132565 | 812.138565 | 5.10 m | 32.01 m | linear | 2.10e+06 | 0.00e+00 | True |
The resulting a peaks table containing the isotopologues M0, M1, and M2 of M+H ion.
The method solution_space is also extremely useful to extract and group all LC-MS peaks originating from a known compound. In our example, we know acetyl-CoA forms the major ion M+H eluting between rtmin = 890s and rtmax = 920s. We will now search the m/z solution space of acetyl-CoA for all other possible peaks originating from the compound in the positive ESI mode.
# use the adduct table with all common positive adducts
adducts = emzed.adducts.positive
# build the solution space
t = sp(target, adducts, explained_abundance=0.95, resolution=6e4)
add_peak_columns(t, 890, 920, coa)
# extract peaks
t = emzed.quantification.integrate(t, "linear", show_progress=False)
t = t.filter(t.area > 1e3)  # keep only features with significant area
print("number of peaks:", len(t))
number of peaks: 16
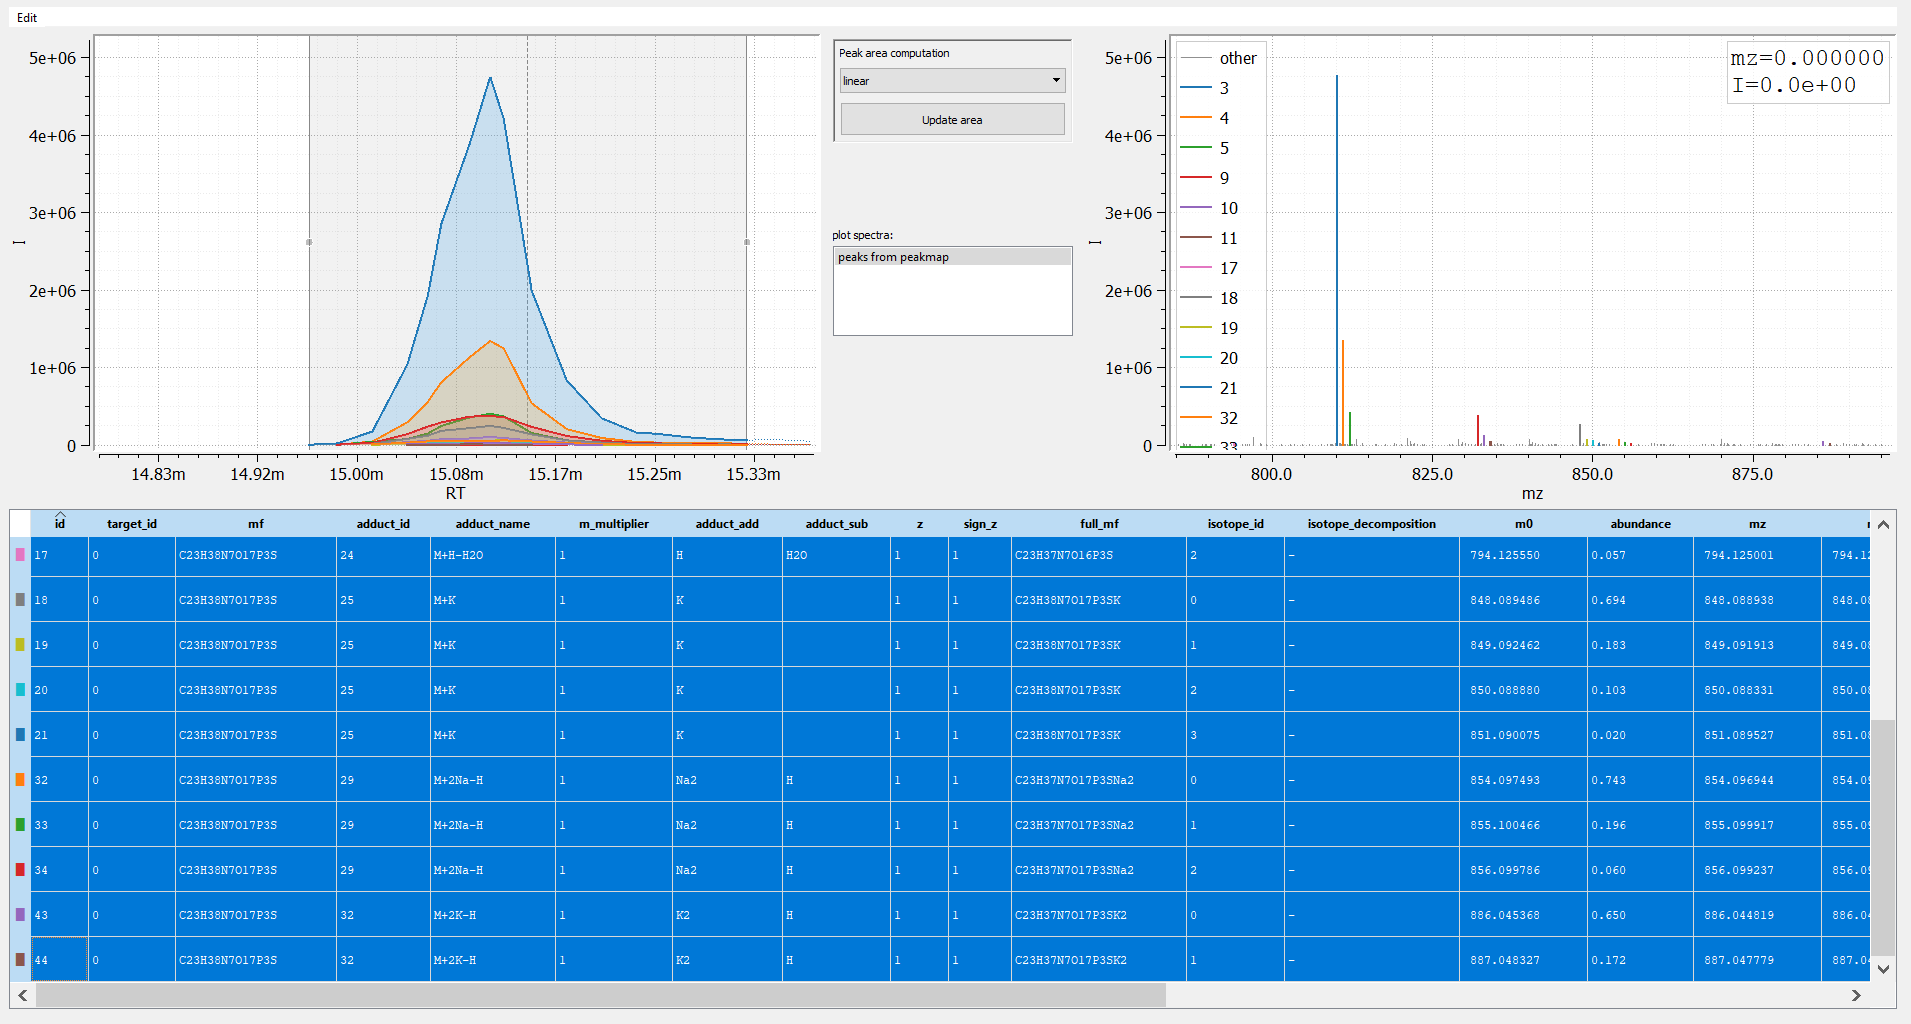
In given example, we can find 16 peaks origination from the single compound acetyl-CoA.