[1]:
%%capture
# setup
import os

import emzed
import numpy as np
import matplotlib.pyplot as plt

# loading peakmap example
data_folder = os.path.join(os.getcwd(), "tutorial_data")
path = os.path.join(data_folder, "CoA_ester_ms_ms2.mzXML")
path_srm = os.path.join(
    data_folder, "Enolase_repeats_AQv1.4.2-20070918_en_10.mzML"
)
coa = emzed.io.load_peak_map(path)
Whenever you open an LC-MS raw data file (‘.mzML’, ‘.mzXML’) using emzed.io.load_peak_map(path), it gets converted into a PeakMap object. Similar to Table, PeakMaps are sqlite databases allowing memory efficient data processing. Simply spoken, a PeakMap is a collection of measured MS spectra providing a number of (mainly) data extraction methods. Each spectum is represented by an emzed Spectra object. In principle, PeakMap, Spectra and associated methods allow handling all common
LC-MS data acquisition approaches. To learn more about PeakMap we will extract some information from the example PeakMap coa. It contains MS and MS-MS data of coenzyme A thioesters. To get an overview of the content we can use the PeakMap method summary:
[2]:
coa.summary()
[2]:
| info | ms_level | value |
|---|---|---|
| str | str | str |
| rt range | 1 | 5.1m .. 32.0m |
| rt range | 2 | 6.2m .. 32.0m |
| mz range | 1 | 700.017 .. 999.976 |
| mz range | 2 | 210.069 .. 1777.090 |
| num_scans | 1 | 1697 |
| num_scans | 2 | 361 |
| polarities | {'+'} | |
| ms_chromatograms | 0 |
Alternatively, we can directly access the different parameters one by one using the corresponding attributes:
[3]:
print(
    f"""
rt range:\t{coa.rt_range()}
mz range:\t{coa.mz_range()}
ms levels:\t{coa.ms_levels()}
spectra:\t{coa.spectra[:2]}
"""
)
rt range:       (306.065, 1920.36)
mz range:       (210.06932067871094, 1777.0897216796875)
ms levels:      {1, 2}
spectra:        [<BoundSpectrum n_peaks=3>, <BoundSpectrum n_peaks=6>]
We already used the method rt_range() in chapter 2 to extract ion chromatograms of amino acids. It returns a tuple with min(RT) and max(RT). Analogous, mz_range and ms_levels return the corresponding values. Note, ms_levels returns a set(), since there is no MS level order in sequences of spectra. Next, we select an arbitrary spectrum:
[4]:
# we select a single spectrum out of the list of spectra
spectrum = coa.spectra[50]

print(
    f"""
scan number:\t{spectrum.scan_number}
retention time:\t{spectrum.rt}
polarity:\t{spectrum.polarity}
MS level:\t{spectrum.ms_level}
precursosr:\t{spectrum.precursors}
peaks: {spectrum.peaks[:5]}"""
)
scan number:    51
retention time: 343.081
polarity:       +
MS level:       1
precursosr:     []
peaks: [[ 761.7154541  2283.57983398]
 [ 782.6260376  2659.90942383]
 [ 784.76593018 2127.91162109]
 [ 798.34472656 2325.74389648]
 [ 831.12145996 2208.859375  ]]
A Spectrum provides retention time in seconds, MS level, polarity, precursor ions, and spectral peaks, which is a list of (mz, intensity) pairs. Since the 51st spectrum is of MS level 1, no precursor ions exist. Next, we will inspect a level 2 Spectrum:
[5]:
# we select a single spectrum out of the list of spectra, this time an MS2 spectrum
spectrum = coa.spectra[794]
print(
    f"""
scan number:\t{spectrum.scan_number}
retention time:\t{spectrum.rt}
polarity:\t{spectrum.polarity}
MS level:\t{spectrum.ms_level}
precursors:\t{spectrum.precursors}
peaks: {spectrum.peaks[-5:]}"""
)
scan number:    795
retention time: 909.846
polarity:       +
MS level:       2
precursors:     [(810.13323975, 1921060.0, 1)]
peaks: [[   792.12030029   2947.25415039]
 [   810.13122559  34063.26171875]
 [   811.1338501  236483.8125    ]
 [   811.46936035   1006.56011963]
 [   818.55566406    664.02734375]]
In case of a level 2 Spectrum, the precursor ion is given as a list containing a single (mz, intensity, MS level) tuple. Note, for spectra of ms level n, precursors contains precursor ions of level 1 up to level n. In principle, emzed3 can handle spectral data of any MS level. In practice, almost exclusively MS level 1 and level 2 data are acquired.
The method chromatogram allows ion chromatogram extraction.
chromatogram(mzmin=None, mzmax=None, rtmin=None, rtmax=None, ms_level=None, precursormzmin=None, precursormzmax=None)
with arguments
mzmin, mzmax: lower and upper mz limit
rtmin, rtmax: lower and upper rt limit (in seconds)
ms_level: the MS level
precursormzmin, precursormzmax: lower and upper precursor mz limit. (only required if ms_level > 1)
returns a list consisting of retention time, intensity pairs, where intensity is the sum of all spectral peaks with mzmin \(\leq\) mz \(\leq\) mzmax.
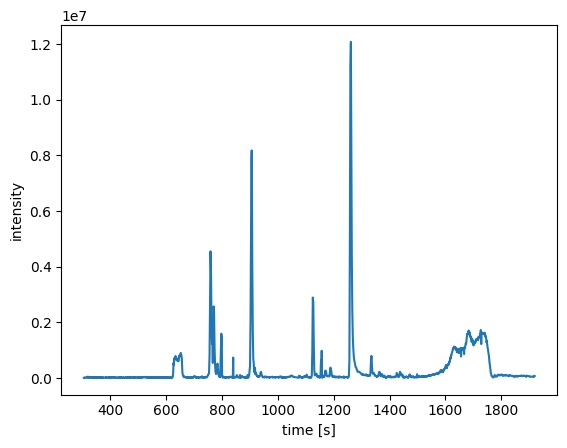
As a simple example, we will extract the total ion current of the MS level 1 peakmap:
[6]:
def plot_chromatogram(rts, intensities):
    plt.plot(rts, intensities)
    plt.xlabel("time [s]")
    plt.ylabel("intensity")
    plt.show()


rts, intensities = coa.chromatogram(ms_level=1)
plot_chromatogram(rts, intensities)

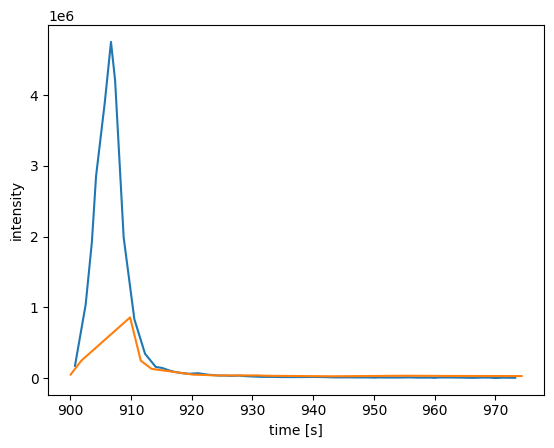
Next, we will extract the EIC of the [M+H] ion of acetyl-CoA and the corresponding TIC of the ms level 2:
[7]:
mz = emzed.mass.of("C23H38N7O17P3S") + emzed.mass.p
print(mz)
mzmin = mz - 0.003
mzmax = mz + 0.003
rts_2, intensities_2 = coa.chromatogram(
    ms_level=2, precursormzmin=mzmin, precursormzmax=mzmax
)
# we limit the plot time range for the MS level 1 EIC to the range of the fragment ion TIC
rtmin = min(rts_2)
rtmax = max(rts_2)
rts_1, intensities_1 = coa.chromatogram(
    mzmin=mzmin, mzmax=mzmax, rtmin=rtmin, rtmax=rtmax, ms_level=1
)

plt.plot(rts_1, intensities_1)
plt.plot(rts_2, intensities_2)
plt.xlabel("time [s]")
plt.ylabel("intensity")
plt.show()
810.133055879012

The method extract allows creating a sub peakmap:
extract(mzmin=None, mzmax=None, rtmin=None, rtmax=None, imin=None, imax=None, mslevelmin=None, mslevelmax=None, precursormzmin=None, precursormzmax=None, *, target_db_file=None)
Arguments:
mzmin, mzmax: lower and upper mz limit
rtmin, rtmax: lower and upper rt limit
imin, imax: lower and uppper intensity limit
precursormzmin, precursormzmax: lower and upper precursor mz limit. (only required if ms_level > 1)
target_db_file: allows defining a path where the resulting file will be stored as sqlite data base to allow memory efficient on disk processing
*: additonal Spectra arguments i.e. polarity, scan_number
The method returns a subset peakmap fullfilling the defined conditions.
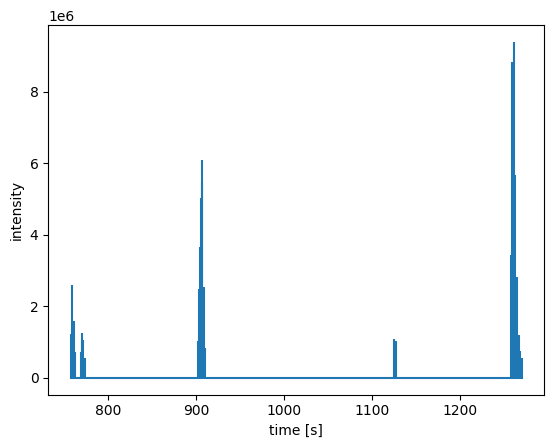
As an example, we will extract the major ms level 1 peaks:
[8]:
coa_major = coa.extract(imin=5e5, mslevelmax=1)
# to visualize the result we plot the correspinding TIC (we use a stem plot since only a few RTs are remaining after the extraciton)
plt.stem(*coa_major.chromatogram(), markerfmt=" ", basefmt="C0-")
plt.xlabel("time [s]")
plt.ylabel("intensity")
plt.show()

The method filter is dedicated to spectral filtering:
filter(predicate, target_db_file=None)
Arguments:
predicate: a function defining filtering condition with Spectrum as unique required argument, returns True or False.
target_db_file: allows defining a path where the resulting file will be stored as sqlite data base to allow memory efficient on disk processing.
The method returns a peakmap containing all spectra fullfilling the predicate.
Since most routine cases are already covered by the method extract, filter will be only needed for very specific cases. In our next example we will filter the peakmap for ms level 2 spectra with a specific neutral loss (the mz difference between precuror ion and fragment ion). First we define the predicate function:
[9]:
neutral = emzed.mass.of("C10H16N5O13P3")
mztol = 0.005


def neutral_loss(spectrum):
    # only spectra of ms level 2 are considered
    if spectrum.ms_level == 2:
        # we extract the mz value of the precursor ion:
        mzprec = spectrum.precursors[0][0]
        # to extract spectral mz values we take the 1st column of peaks array
        # if we add the neutral loss to the fragment ions resulting mz value
        # equals precursor ion mz with tolerance mztol
        delta = np.abs(spectrum.peaks[:, 0] + neutral - mzprec)
        candidates = delta[delta <= mztol]
        return len(candidates) > 0
    return False


sub = coa.filter(neutral_loss)
print(
    f"""number of spectra
before:\t{len(coa)}
after:\t{len(sub)}"""
)
number of spectra
before: 2058
after:  185
The method get_dominating_peak_map yields a PeakMap containing all spectra of lowest MS level. In case of MS level N experiments those spectra contain the source (precursor) ions of subsequent fragmentations and hence are dominating.
coa.get_dominating_peak_map()
With very few exceptions, the dominating peak map is always level 1 and the method is identical to
coa.extract(mslevelmax = 1)
The method representing_mz_peak returns the most intense spectrum peak in a user defined rt and mz range.
representing_mz_peak(mzmin, mzmax, rtmin, rtmax, ms_level=1)
with arguments
mzmin, mzmax: lower and upper mz limit
rtmin, rtmax: lower and upper rt limit
ms_level: the MS level
[10]:
coa.representing_mz_peak(
    mzmin=750, mzmax=850, rtmin=6 * 60.0, rtmax=10 * 60.0, ms_level=1
)
[10]:
np.float64(796.3164026464547)
The method get_precursors_mzs returns a set of all precursor mz values as tuple
[11]:
precursors = coa.get_precursors_mzs()
print("number of precursor ions:", len(precursors))
# we will show the first
precursors.pop()
number of precursor ions: 124
[11]:
(872.14941406,)
The method split_by_precursors creates a dictionary {(level n-1 precursor,), level n peakmap}
split_by_precursors(mz_tol = 0.0)
with argument mz_tol: maximal allowed mz difference of precursor ions. Default: 0.0
When we apply the method with a m/z tolerance of 0.005 for the precursor ion we obtain
[12]:
pairs = coa.split_by_precursors(0.005)
len(pairs)
[12]:
33
A potential use case would be a targeted MS level 2 approach based on the peak area of the common CoA ester fragment ion at m/z 428.0367:
[13]:
precursors, pms = zip(*pairs.items())
mz_tol = 0.003
# we create an exctraction table
t = emzed.to_table(
    "precursors", precursors, object
)  # tuple is not allowed as type, therefore object is used
t.add_column_with_constant_value("mz", 428.0367, emzed.MzType)
t.add_column("mzmin", t.mz - mz_tol, emzed.MzType)
t.add_column("mzmax", t.mz + mz_tol, emzed.MzType)
t.add_column("peakmap", pms, emzed.PeakMap)
t.add_column(
    "rtmin",
    t.apply(lambda v: v.rt_range()[0], t.peakmap),
    emzed.RtType,
)
t.add_column(
    "rtmax",
    t.apply(lambda v: v.rt_range()[1], t.peakmap),
    emzed.RtType,
)
t.add_enumeration()
t = emzed.quantification.integrate(t, "linear", show_progress=False)
t = t.filter(t.area > 0)
t
[13]:
| id | precursors | mz | mzmin | mzmax | rtmin | rtmax | peak_shape_model | area | rmse | valid_model |
|---|---|---|---|---|---|---|---|---|---|---|
| int | object | MzType | MzType | MzType | RtType | RtType | str | float | float | bool |
| 0 | (872.145,) | 428.036700 | 428.033700 | 428.039700 | 7.25 m | 31.95 m | linear | 6.81e+06 | 0.00e+00 | True |
| 1 | (864.175,) | 428.036700 | 428.033700 | 428.039700 | 6.20 m | 17.86 m | linear | 2.76e+04 | 0.00e+00 | True |
| 2 | (810.13,) | 428.036700 | 428.033700 | 428.039700 | 14.97 m | 17.92 m | linear | 2.03e+06 | 0.00e+00 | True |
| 3 | (872.15,) | 428.036700 | 428.033700 | 428.039700 | 7.25 m | 31.95 m | linear | 6.81e+06 | 0.00e+00 | True |
| 4 | (864.18,) | 428.036700 | 428.033700 | 428.039700 | 6.20 m | 17.86 m | linear | 2.76e+04 | 0.00e+00 | True |
| 9 | (838.165,) | 428.036700 | 428.033700 | 428.039700 | 19.57 m | 19.60 m | linear | 9.24e+03 | 0.00e+00 | True |
| 11 | (894.15,) | 428.036700 | 428.033700 | 428.039700 | 14.18 m | 14.68 m | linear | 3.71e+04 | 0.00e+00 | True |
| 13 | (910.185,) | 428.036700 | 428.033700 | 428.039700 | 14.53 m | 16.33 m | linear | 4.31e+03 | 0.00e+00 | True |
| 14 | (868.135,) | 428.036700 | 428.033700 | 428.039700 | 12.56 m | 16.12 m | linear | 1.10e+06 | 0.00e+00 | True |
| 15 | (892.17,) | 428.036700 | 428.033700 | 428.039700 | 18.92 m | 27.77 m | linear | 9.98e+05 | 0.00e+00 | True |
| 16 | (854.12,) | 428.036700 | 428.033700 | 428.039700 | 11.63 m | 11.84 m | linear | 2.14e+04 | 0.00e+00 | True |
| 17 | (854.16,) | 428.036700 | 428.033700 | 428.039700 | 15.60 m | 15.81 m | linear | 8.56e+04 | 0.00e+00 | True |
| 19 | (854.155,) | 428.036700 | 428.033700 | 428.039700 | 15.60 m | 15.81 m | linear | 8.56e+04 | 0.00e+00 | True |
| 21 | (838.16,) | 428.036700 | 428.033700 | 428.039700 | 18.29 m | 23.78 m | linear | 6.94e+04 | 0.00e+00 | True |
| 23 | (814.13,) | 428.036700 | 428.033700 | 428.039700 | 15.08 m | 15.13 m | linear | 1.42e+03 | 0.00e+00 | True |
| 26 | (824.15,) | 428.036700 | 428.033700 | 428.039700 | 6.90 m | 28.79 m | linear | 2.07e+05 | 0.00e+00 | True |
| 27 | (868.14,) | 428.036700 | 428.033700 | 428.039700 | 12.56 m | 16.12 m | linear | 1.10e+06 | 0.00e+00 | True |
| 30 | (910.19,) | 428.036700 | 428.033700 | 428.039700 | 14.53 m | 16.33 m | linear | 4.31e+03 | 0.00e+00 | True |
| 31 | (810.135,) | 428.036700 | 428.033700 | 428.039700 | 15.00 m | 16.57 m | linear | 2.02e+06 | 0.00e+00 | True |
For 29 out of the 33 precursor ions we obtained peak areas > 0 for the common CoA ester fragment ion.
The method merge allows merging of none overlapping peakmaps.
merge(self, other)
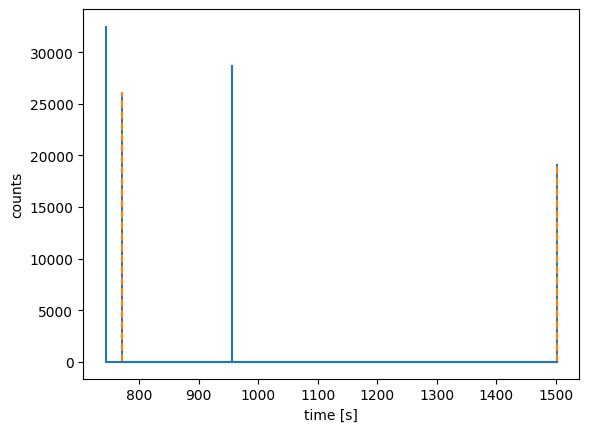
An example: We can merge 2 peakmaps form the list of peakmaps pms we obtained when we applied the split_by_precursor method (see above).
[14]:
pm1, pm2 = pms[6:8]
pm1.merge(pm2)
plt.stem(
    *pm1.chromatogram(), linefmt="C0-", markerfmt=" ", basefmt="C0-"
)
plt.stem(
    *pm2.chromatogram(), linefmt="C1--", markerfmt=" ", basefmt="C0-"
)
plt.xlabel("time [s]")
plt.ylabel("counts")
plt.show()

The peakmap pm1 (blue) includes now peakmap pm2 (orange).
Note, merging is in place and spectral scan_numbers of the two peakmaps must not overlap! Once you applied merge, you cannot execute merge a second time since the function does not replace existing spectra.
PeakMap supports adding spectra to an existing peakmap using the context manager spectra_for_modification. WARNING: The method can manipulate raw data and such manipulation should be indicated!
with peakmap.spectra_for_modifications() as sp:
    sp.add_spectra(spectrum)
Note, adding a spectrum to a PeakMap requires a with statement. It adds a Spectrum in place.
This is a good opportunity to learn how to create a new Spectrum from scatch:
Spectrum(scan_number, rt, ms_level, polarity, precursors, peaks)
We will add a new spectrum of MS level 1 and a single MS peak at the end of the peakmap coa:
[15]:
# get the current maximal spectrum scan_number
scan_no = coa.spectra[-1].scan_number
scan_no += 1
# maximum rt
rt = coa.rt_range()[1] + 5.0
# create an evil peak
peaks = np.array([[666.666, 1e8]])
spectrum = emzed.Spectrum(scan_no, rt, 1, "+", [], peaks)

with coa.spectra_for_modification() as sp:
    sp.add_spectrum(spectrum)
[16]:
rts, ints = coa.chromatogram()
print(
    f"""
retention time:\t{rts[-1]/60:.1f} min
intensity:\t{ints[-1]:.1e}"""
)
retention time: 32.1 min
intensity:      1.0e+08
We can simply check for any peakmap modification by checking the attribute unique_id. It returns a unique identifier.
In example:
[17]:
print("before:", coa.unique_id)
# we add a second spectrum
scan_no = coa.spectra[-1].scan_number
scan_no += 1
# maximum rt
rt = coa.rt_range()[1] + 5.0
# create an evil peak
peaks = np.array([[666.666, 1e8]])
spectrum = emzed.Spectrum(scan_no, rt, 1, "+", [], peaks)
with coa.spectra_for_modification() as sp:
    sp.add_spectrum(spectrum)
print("after:", coa.unique_id)
before: ebda6261ec5e80fc183affd36a09a124
after: 26cc1ac2819445fa24e9e2729034ab9f
We can undo add_spectrum with the Spectrum method unbind. It detaches the spectrum from the peakmap:
[18]:
# remove the last added spectrum
spectrum = coa.spectra[-1]
spectrum.unbind()
coa.unique_id
[18]:
'26cc1ac2819445fa24e9e2729034ab9f'
The PeakMap method representing_mz_peak
representing_mz_peak(mzmin, mzmax, rtmin, rtmax, ms_level=1)
with arguments
mzmin, mzmax: lower and upper mz limit
rtmin, rtmax: lower and upper rt limit
ms_level: selected MS level. Default value is 1.
returns the log(intensity) weighted average mz value of a defined mz/RT window.
representing_mz_peak can be used to determine the “average”/representing mz value of a peak.
As an example we will determine the representing mz value of acetyl-CoA eluting at 15 min:
[19]:
mz = 810.1331  # mz of acetyl-CoA
mz_tol = 0.003
rtmin = 900  # in seconds
rtmax = 910
coa.representing_mz_peak(mz - mz_tol, mz + mz_tol, rtmin, rtmax)
[19]:
np.float64(810.1324484513556)
Finall, PeakMap provides a dictionary meta_data. We recommend to document all PeakMap manipulation in the meta_data.
[20]:
coa.meta_data.keys()
[20]:
['full_source', 'source']
[21]:
coa.meta_data["source"]
[21]:
'CoA_ester_ms_ms2.mzXML'
We can use meta_data to document any peak map manipulation, e.g.
[22]:
coa.meta_data["modified"] = True
Emzed allows reading peakmaps from selected reaction monitoring (SRM) experiments. Those peakmaps contain only chromatograms and no spectra. In the following we will use an example file from ProteoWizard that you can download from here.
[23]:
srm_peakmap = emzed.io.load_peak_map(path_srm)
print(
    "Number of chromatograms: %s" % len(srm_peakmap.ms_chromatograms)
)
print("Number of spectra: %s" % len(srm_peakmap.spectra))
Number of chromatograms: 8
Number of spectra: 0
Let’s have a closer look at the ms_chromatograms. First, we select a a single chromatogram:
[24]:
chromatogram = srm_peakmap.ms_chromatograms[-1]
A chromatogram has the attributes
available_types: possible chromatogram types
intensities: 1D array of intensity values
mz: m/z value of the fragment ion
precursor_mz: m/z value of the precursor ion
rt_range: method returning a tuple with rt values at start and and of chromatogram
rts: 1D array of retention time values
type: type of current chromatogram
Let’s inspect some attributes of the selected chromatogram:
[25]:
print(f"available types: {', '.join(chromatogram.available_types)}\n")
print(f"type:\t\t {chromatogram.type}")
print(f"m/z:\t\t {chromatogram.mz}")
print(f"rt range:\t{chromatogram.rt_range()}")
available types: MASS_CHROMATOGRAM, TOTAL_ION_CURRENT_CHROMATOGRAM, SELECTED_ION_CURRENT_CHROMATOGRAM, BASEPEAK_CHROMATOGRAM, SELECTED_ION_MONITORING_CHROMATOGRAM, SELECTED_REACTION_MONITORING_CHROMATOGRAM, ELECTROMAGNETIC_RADIATION_CHROMATOGRAM, ABSORPTION_CHROMATOGRAM, EMISSION_CHROMATOGRAM

type:            SELECTED_REACTION_MONITORING_CHROMATOGRAM
m/z:             1172.71
rt range:       (np.float32(337.864), np.float32(3001.052))
Next we list the types of all chromatograms present in ms_chromatograms:
[26]:
[chrom.type for chrom in srm_peakmap.ms_chromatograms]
[26]:
['TOTAL_ION_CURRENT_CHROMATOGRAM',
 'BASEPEAK_CHROMATOGRAM',
 'SELECTED_REACTION_MONITORING_CHROMATOGRAM',
 'SELECTED_REACTION_MONITORING_CHROMATOGRAM',
 'SELECTED_REACTION_MONITORING_CHROMATOGRAM',
 'SELECTED_REACTION_MONITORING_CHROMATOGRAM',
 'SELECTED_REACTION_MONITORING_CHROMATOGRAM',
 'SELECTED_REACTION_MONITORING_CHROMATOGRAM']
Emzed supports extracting chromatograms EIC peaks:
[27]:
t = emzed.peak_picking.extract_ms_chromatograms(srm_peakmap)
The command results a table with the columns
id, rtmin_chromatogram, rtmax_chromatogram, precursor_mz_chromatogram, mz_chromatogram, type, and chromatogram

Note: To distinguish between spectra and chromatogram data, all columns refering to MSChromatogram have the postfix _chromatogram
Similar to spectral data, emzed support integrating chromatograms:
[28]:
emzed.quantification.integrate_chromatograms(
    t, "linear", in_place=True
)
100%|██████████| 8/8 [00:00<00:00, 3778.65it/s]
needed 0.0 seconds
[ ]:

integrate_chromatograms is very similar to the emzed integrate) and the same integration algorithms are available. Analogous, it adds columns peak_shape_model_chromatogram, area_chromatogram, rmse_chromatogram, model_chromatogram, and valid_model_chromatogram to the table.
© Copyright 2012-2025 ETH Zurich
Last build 2025-10-28 13:23:38.200852.
Created using Sphinx 8.1.3.